
- Sequence conservation is a key ingredient in most nucleotide mutation severity predictors.
- The covariance within it powers the AlphaFold2 Evoformer and other de novo structure predictors.
- The phylogeny extracted from it tells the evolutionary tale of the protein
Forenote
Footnote on lead
Making the MSA itself: humans
Doing a BLAST search will return an endless troop of monkeys and conspiracy of lemurs, which lacks divergence, so often a manual selection is more useful for figures. This has four points to note.
1. Genome quality
2. NCBI or Uniprot?
I normally use Uniprot because the curation is better for model organisms, but NCBI is way better curated than Uniprot for non-model organism. In NCBI, there may be multiple entries with different lengths, these may be different isoforms or a paralogue —if from a blast search the identify percentage will be similar for the former, but not the latter.3. Sidenote: common name or scientific name?
 |
The scientific names in a Blast search:
|
I personally prefer using the common name of the species or better the single word name of a parent taxon, because to me most scientific names are gibberish. I can speak Italian, which makes guessing some less common Latin names easier, for example a blackbird is a «merlo» and its Latin name is Turdus merula*, but most are still alien, for example a red kite is a «nibbio reale», but its Latin name is Milvus milvus.
*) In the above sentence, I should have said "Eurasian blackbird" if I wanted to be pedantically precise, but for most applications this is just pointless noise...
I am also of the opinion that using kelvin in an enzymology paper is utterly ridiculous, but I have been told this is a sign I am a rubbish scientist. So as said, preference for intelligible common names is my personal opinion and I may be a bad scientist for it!
4. Animal phylogeny
- Lamprey (Petromyzon marinus) are the thing of nightmares, but predate the genome double duplication event in jawed fish, so are very nice phylogenetically as often ends up being the outgroup. When a gene family is still duplicated in lampreys one can go back further:
- Sea urchin (Strongylocentrotus purpuratus) is basal to vertebrates. It is an invertebrate, but not of insect, molluscs and worms kind (deuterostome not protostome). So it is more closely related to us than insects, molluscs and worms.
- Coral (Acropora millepora) is an animal that is basal to all others.
- Zebrafish (Danio rerio) is a ray finned fish with a curated genome. Most ray-finned fish however descent from an ancestor with a genome duplication event. Tetrapods (land vertebrates) evolved from lobe finned fish, for which the extant examples are lung fish and coelacanths.
- Coelacanth (Latimeria chalumnae) is not a Pokémon found in New Zealand —that's Relicanth—but a fish basal to tetrapods. Together ray-finned fish and lobe-finned fish form the boney fish, whose common ancestors had two genome duplication events, once after lampreys diverged and the second possibly after sharks (jawed cartilaginous fish).
- Great white shark (Carcharodon carcharias) is a sequenced shark along with two others.
- Sturgeon (Acipenser ruthenus) is a basal ray-finned fish that predates the genome duplication seen in zebrafish. For the purpose of diversity of a gene that duplicated in lampreys, fish are really useful as they are diverse despite looking all the same —so picking some fish near randomly would work. Do note that zebrafish is a minnow, which is in the same family as carp (sequenced).
- Axolotl (Ambystoma mexicanum) is an amphibian, which are basal tetrapods.
In mammals, the phylogeny is well known. The basal monotremes platypus (Ornithorhynchus anatinus) and echidna (not sequenced) lay eggs and marsupials, such as a wallabies (Notamacropus eugenii, no big kangaroos sequenced) and wombats (Vombatus ursinus) have pouches. Then there's a radiation of different placental mammals, which means that pinning the precise relationship between the clades has been tricky and that the representative sequence divergence is not going to suffer if the chosen representative species is not quite basal—for a detailed review of mammalian phylogeny see this review. Also, if someone is interested in showing a protein MSA, the best example of sequence conservation/divergence is further down the tree. Two things need noting, mammalian carnivores form a single clade and many mammals that come to mind are from this clade, while cloven animals and cetaceans form a clade (Cetartiodactyla)—this is not important, but I really wanted to mention that hippos and whales had a common ancestor called a "whippo" (hence the clade name Whippomorpha), which is a fantastic name.
Bacterial MSA
Python and MSAs
Starting from the basics, retrieving sequences from NCBI is easy with BioPython:
from Bio import Entrez
Entrez.email = "👻@👻.👻"
Entrez.api_key = "👾👾👾👾"  # you get this by registering
with Entrez.efetch(db="protein", id=target, rettype="fasta", retmode="text") as handle:
    fasta = handle.read()
Likewise, with UniProt it is even easier:
url = f'https://www.uniprot.org/uniprot/{uniprot_id}.fasta'
reply = requests.get(url)
assert reply.status_code == 200, f'{reply.status_code}: {url}'
fasta = reply.text
One thing to note is that Uniprot and NCBI have different header format, for example here are two functions to get information from them (without using BioPython):
def split_ncbi_fasta(fasta:str) -> dict: # keys: ['accession', 'description', 'species', 'sequence']
return re.match('\>(?P<accession>\S+)\s+(?P<description>.*)\s+\[(?P<species>.*)\](?P<sequence>\w*)', fasta.replace('\n','')).groupdict()def split_uniprot_fasta(fasta:str) -> dict: # keys: ['type', 'accession', 'name', 'description', 'args', 'OS' = species, 'OX', 'GN', 'PE', 'sequence']
match = re.match(r'\>(?P<type>\w+)\|(?P<accession>.*?)\|(?P<name>[\w\_]+)\s(?P<description>.*?)\s(?P<args>\w+\=.*)', fasta).groupdict()
details = dict(re.findall(r'(\w+)\=(.*?)\s+\n', # there is a way to split this more cleanly...
re.sub(r'(\w+\=)', r'\n\1', match['args']+'\n')
)
)
return {**match, **details, 'sequence': ''.join(fasta.split('\n')[1:])}The next few operations (i.e. writing a fasta file with headers of one's choice, aligning locally via a muscle3 system call or remotely via Muscle server or any other aligner and reading the aligned sequences again) are very straightforward, but have a few personal choices, e.g. how to clean the labels, whether to use pandas or dictionaries etc.
One operation that is not too straightforward is getting the equivalent residue position between two sequences which requires one to remember to correct the position as they aren't zero-indexed making it an otherwise simple operation namely creating a list where each index corresponds to the zero-indexed ungapped position of the sequence, while the elements are the index of these in the alignment:
def get_mapping(seq: str) -> List[int]:
    """Given a sequences with gaps return a zero-index
    list mapping ungapped position --> gapped position """
    return [i for i, p in enumerate(seq) if p != '-']

def convert(query_seq: str, target_seq: str, position: int) -> int:
    """
    Given a query sequence (aligned) and target sequence (aligned)
    and a ungapped query position, return the ungapped target position

    :param query_seq: aligned
    :param target_seq: aligned
    :param position: query residue number counted from 1
    :return: target residue number counted from 1
    """
    query_mapping = get_mapping(query_seq)
    target_mapping = get_mapping(target_seq)
    mp = query_mapping[position - 1]
    return target_mapping.index(mp) + 1
The next thing is the figure. This is actually really straightforward and can be done with a scatterplot, where the datapoints are a residue represented by label without the marker shown and the position is to make a grid. For example:
import plotly.graph_objects as go
import numpy as np
from collections import Counter
from typing import *

def make_fig(al_seqs: Dict[str, str], position: int, names: Optional[List[str]] = None) -> go.Figure:
    """
    This make a fake scatter plot with letters for each position in Plotly.

    :param al_seqs: aligned seq dictionary of names to seqs w/ gaps (aligned)
    :param position: position to show based on the first name
    :param names: order or the seqs to show top to bottom —if subset only these will be shown
    :return:
    """
    # --------------------------------------------------
    # prep
    if names is None:
        names = list(al_seqs.keys())
    elif len(names) != len(al_seqs):
        sub_al_seqs = {name: [] for name in names}
        for i in range(len(al_seqs[names[0]])):
            if any([al_seqs[name][i] != '-' for name in names]):
                for name in names:
                    sub_al_seqs[name].append(al_seqs[name][i])
        for species in sub_al_seqs:
            sub_al_seqs[species] = ''.join(sub_al_seqs[species])
        al_seqs = sub_al_seqs
    # mapping
    first = al_seqs[names[0]]
    n = len(first)
    mapping = get_mapping(first)
    position = position - 1
    start = mapping[position] - 10
    mid = mapping[position]
    stop = mapping[position] + 10
    # out of bonds prevention
    if start < 0:
        forepadding  = ['>'] * abs(start)
        mid += abs(start)
        start = 0
    else:
        forepadding = []
    if stop > n:
        aftpadding  = ['<'] * stop - n
        stop = n
    else:
        aftpadding = []
    # --------------------------------------------------
    # Add letters
    scatters = [go.Scatter(x=np.arange(start, stop + 1),
                           # y=[-i/yzoom] * 20,
                           y=[name] * 21,
                           text=forepadding + list(al_seqs[name][start:stop + 1]) + aftpadding,
                           textposition="middle center",
                           # textfont_size=10,
                           textfont=dict(
                               family="monospace",
                               size=12,
                               color="black"
                           ),
                           name=name,
                           mode='text') for i, name in enumerate(names)
                ]
    # --------------------------------------------------
    # Add red box
    fig = go.Figure(data=scatters)
    fig.add_shape(type="rect",
                  x0=mid - 0.5, x1=mid + 0.5,
                  # y0=0.5/yzoom, y1=(0.5 -len(al_seqs))/yzoom,
                  y0=0 - 0.5, y1=len(names) - 1 + 0.5,  # the len is off-by-one
                  line=dict(color="crimson"),
                  )
    fig.update_shapes(dict(xref='x', yref='y'))
    # --------------------------------------------------
    # Add turquoise squares
    for i in range(start, stop + 1):
        residues = [al_seqs[name][i] for name in names]
        mc = Counter(residues).most_common()[0][0]
        for j, r in enumerate(residues):
            if mc == '-':
                continue
            elif r == mc:
                fig.add_shape(type="rect",
                              x0=i - 0.5, x1=i + 0.5,
                              # y0=(-j -.5)/yzoom, y1=(-j +.5)/yzoom,
                              # y0=names[j], y1=names[j],
                              y0=j - 0.5, y1=j + 0.5,
                              fillcolor="aquamarine", opacity=0.5,
                              layer="below", line_width=0,
                              )
    # --------------------------------------------------
    # Correct
    fig.update_layout(template='none',
                      showlegend=False,
                      title=f'Residue {position + 1}',
                      xaxis={
                          'showgrid': False,
                          'zeroline': False,
                          'visible': False,
                          # 'range': [start,stop],
                      },
                      yaxis={
                          'showgrid': False,
                          'zeroline': False,
                          'visible': True,
                          'autorange': 'reversed'
                      }
                      )
    # --------------------------------------------------
    return fig
This would make something like:
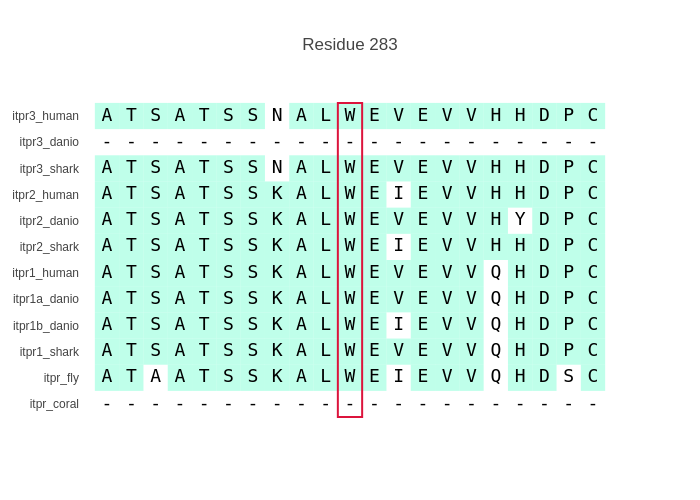
By doing it this way one can easily change how the plot is made, such as colour only residues that match the first one or make the labels slanted (fig.update_layout(yaxis=dict(tickangle = -45) )). One thing to note however is that the above function makes only a window and if the whole sequences are used and zoomed in (via the range argument to the layout of xaxis) one can zoom and scroll around, but the figure becomes very heavy due to the added shapes (turquoise background).
No comments:
Post a Comment